Guide HomeGetting StartedPlan Setup WizardDashboardCash FlowTax AnalyticsTax PlannerChance of SuccessWhat-If ScenariosWellness ScoreCompareYour Data & Privacy
Screenshots show the built-in sample plan — your numbers will look different, but the layout is the same.
Chance of Success
Monte Carlo simulations and historical backtests — fan charts, trial drill-down, heatmaps, and sparklines.
Monte Carlo tab
Controls band
- Trials select: 1k, 5k, or 10k paths
- Block Bootstrap checkbox: Replays real 12-month return blocks instead of parametric draws
- Run simulation button: Shows "Running..." while in flight
- Reset button: Clears results
Verdict band (after run)
Three-part grid: donut gauge, verdict callout with icon and prose, outcome categories panel with 5 colored rows.
Three KPI cards
- Median legacy (indigo): Median ending balance with mean
- Bad-luck p10 legacy (coral): 1-in-10 downside
- Good-luck p90 legacy (green): 1-in-10 upside
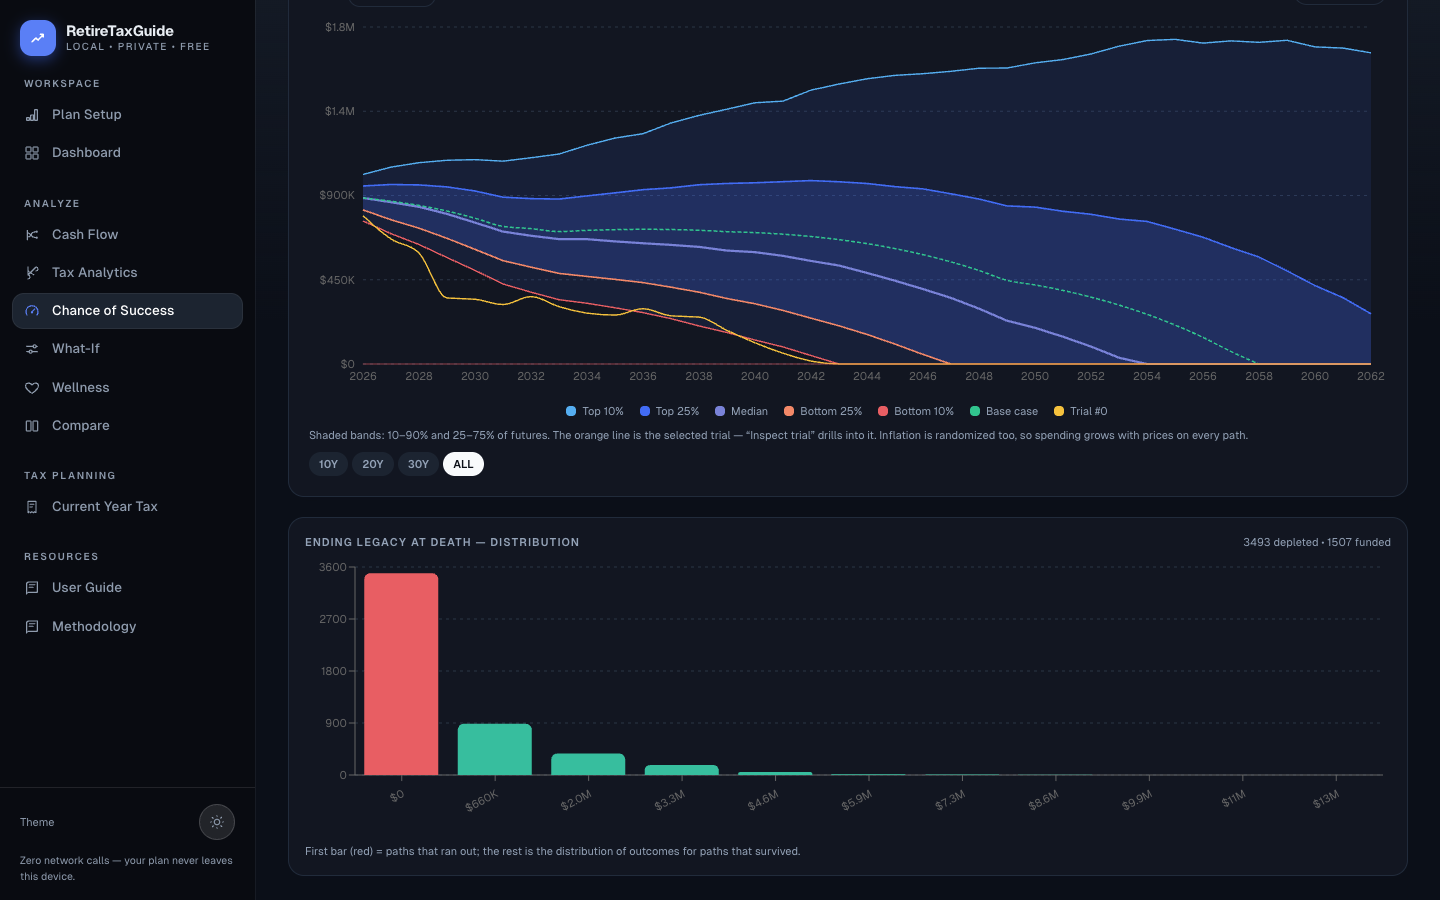
How to read
Use the trial slider to select a specific trial. Click "Inspect trial" to drill into a year-by-year table with vs-median differences. Click "Distribution view" to exit.
Historical Backtest tab
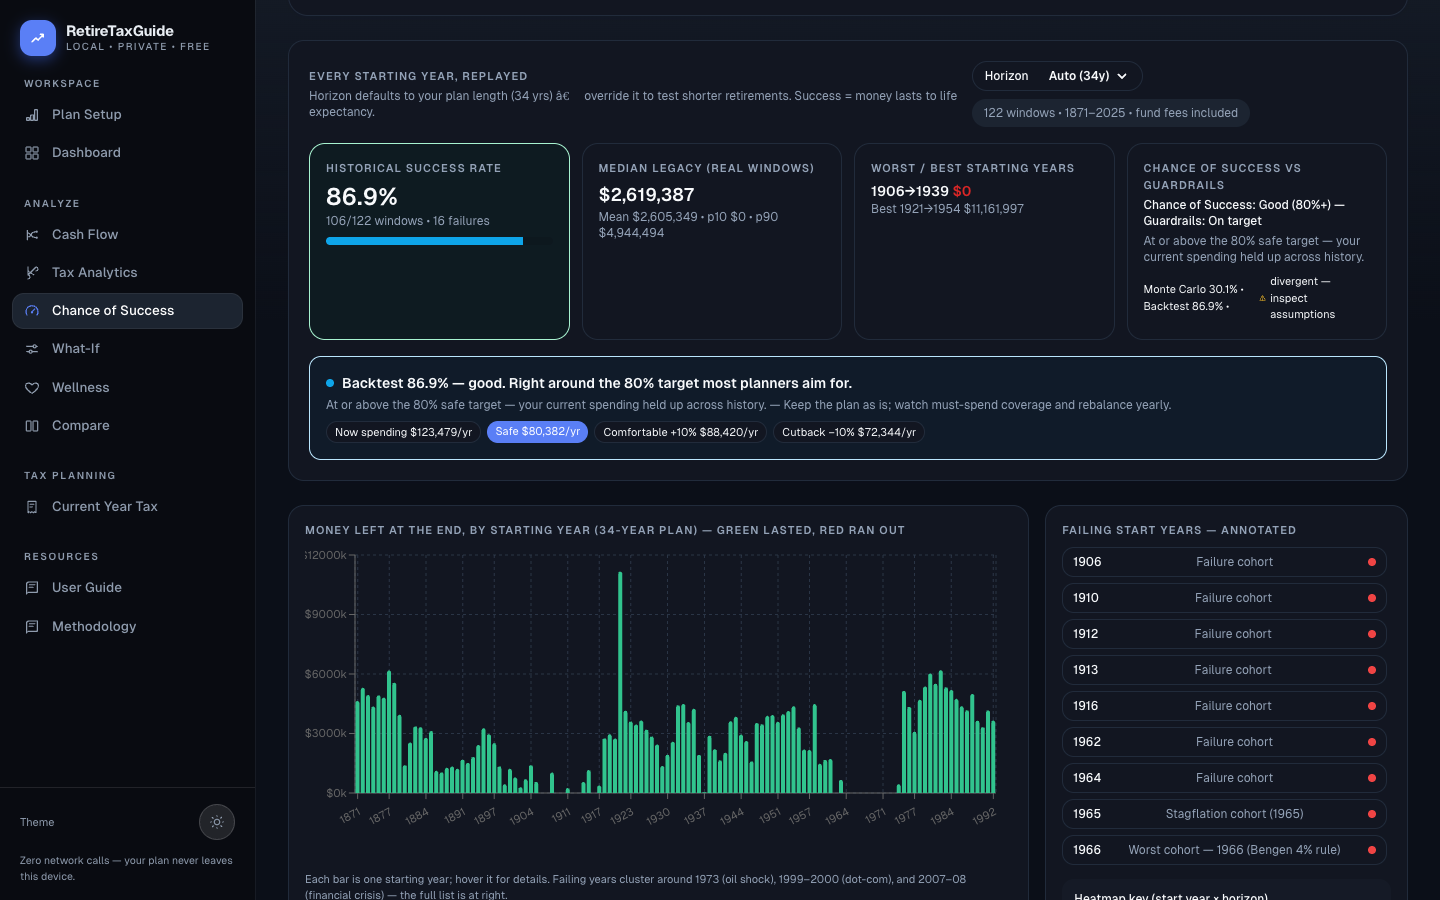
Four KPI cards
- Historical success rate: Tinted card with percentage and progress bar
- Median legacy (real windows): With Mean / p10 / p90
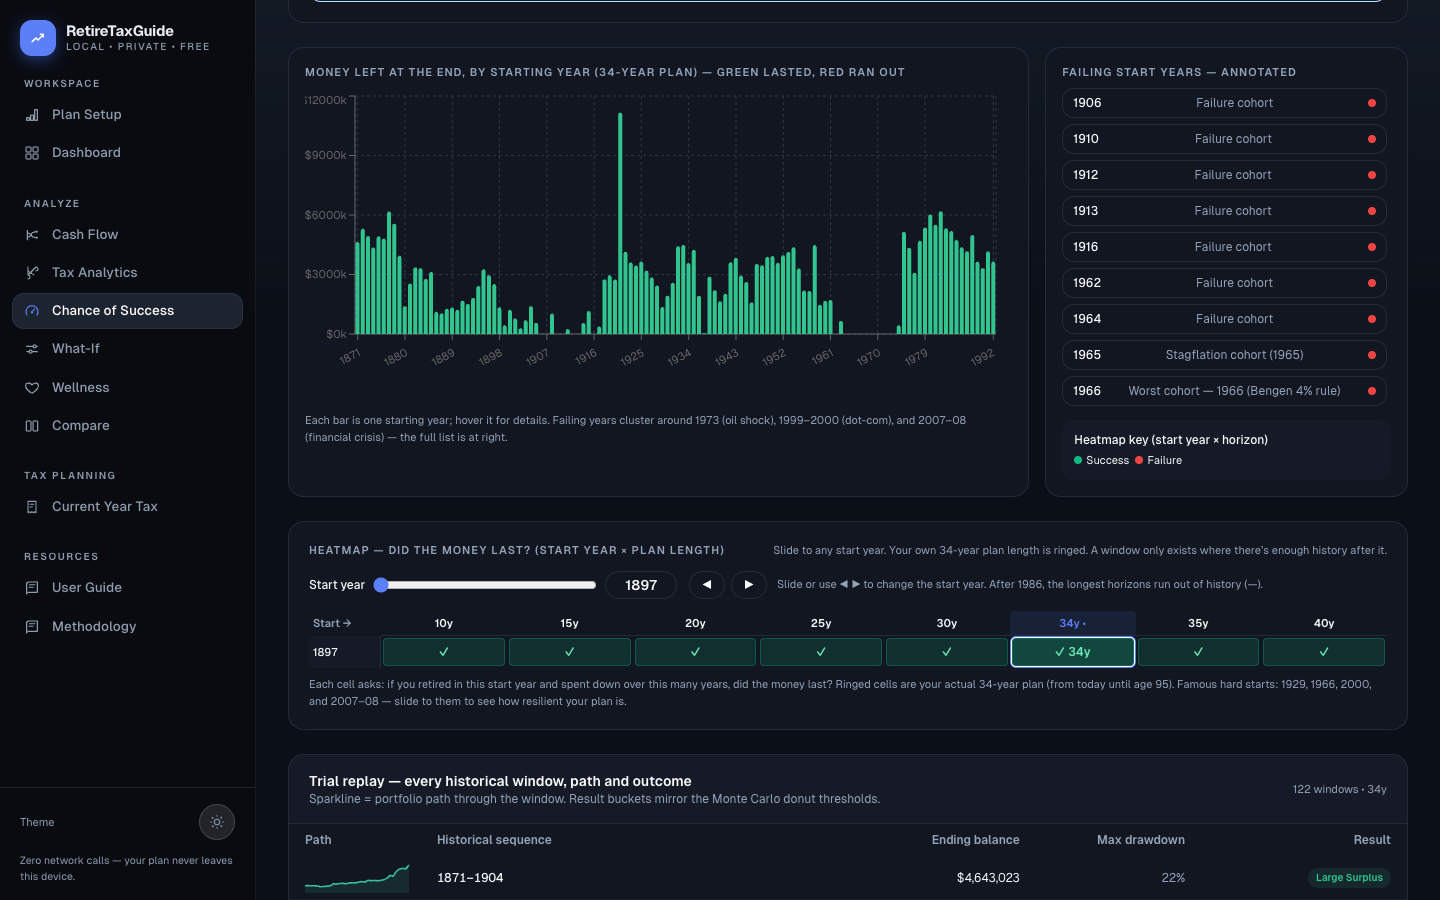
- Worst/best starting years: With crisis annotations
- Chance of Success vs Guardrails: Monte Carlo comparison with alignment check
Reading the three success numbers
A closing card reconciles the Base case (one straight-line path), Monte Carlo (random futures), and Backtest (real windows). The three should roughly agree — if they diverge, the card explains what that implies. Rule of thumb: at or above 95% you could spend more, around 80% you are on target, near 70% be cautious, below it consider cutting back.