Guide HomeGetting StartedPlan Setup WizardDashboardCash FlowTax AnalyticsTax PlannerChance of SuccessWhat-If ScenariosWellness ScoreCompareYour Data & Privacy
Screenshots show the built-in sample plan — your numbers will look different, but the layout is the same.
Tax Analytics
Understand your tax burden across the entire plan — composition, rates, and brackets.
Four KPI metric cards (top row)
- Lifetime tax (violet): Sum of federal + FICA + IRMAA.
- Avg effective rate (blue): Federal tax divided by total income.
- Roth conversion yrs (teal): Count of years with Roth conversions.
- IRMAA exposure (orange/green): Years with Medicare surcharge.
Tab switcher
A pill-button group with three tabs: Composition, Rates, Brackets. The active tab gets a white background.
Tab 1 — Composition
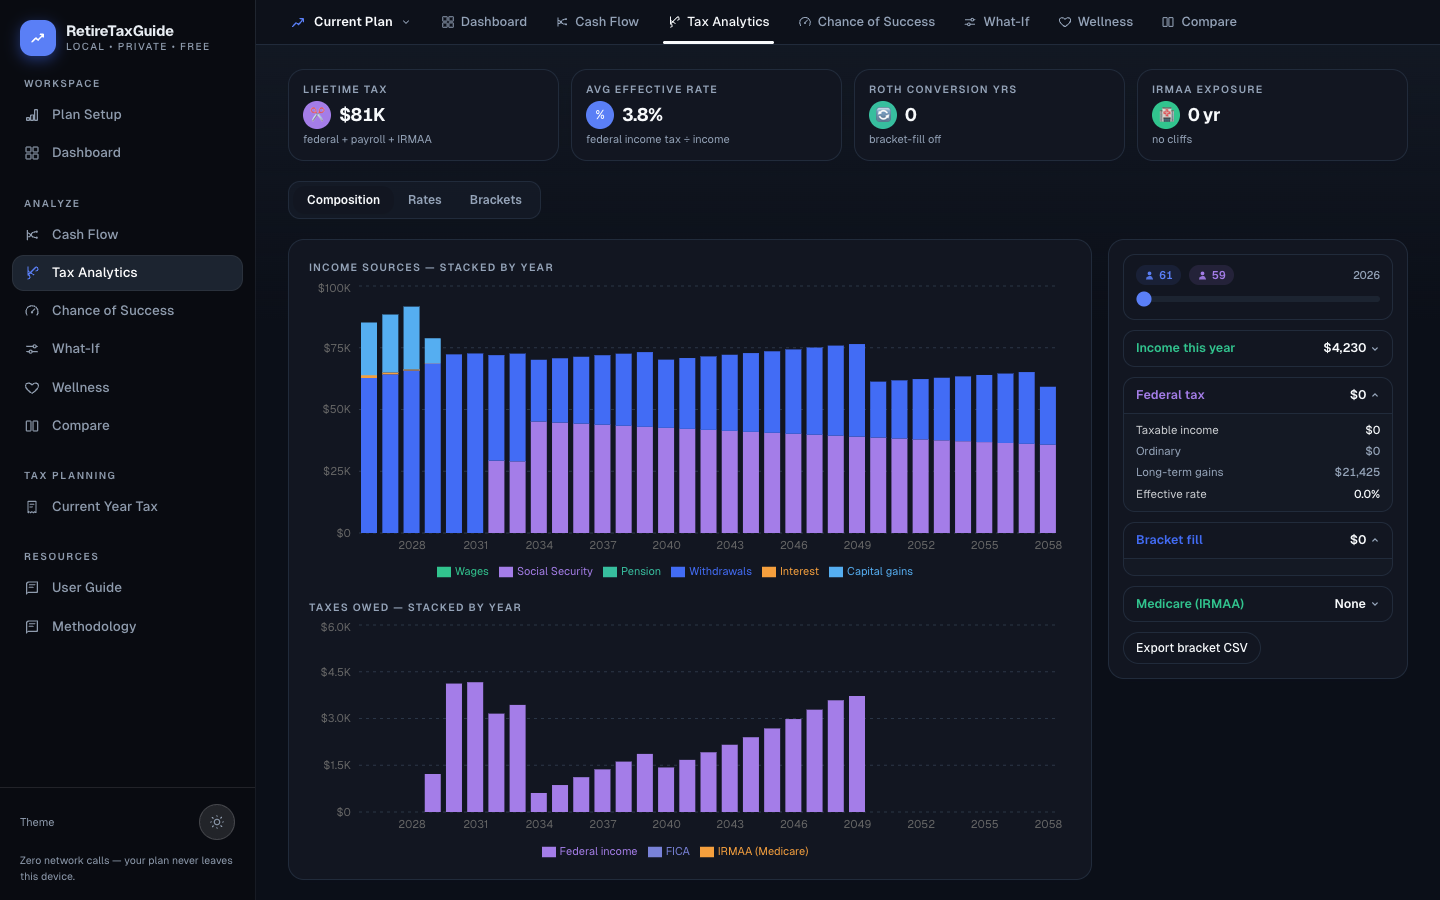
Income sources chart
- Green: Wages
- Violet: Social Security
- Teal: Pension
- Primary blue: Withdrawals
- Orange: Interest
- Sky: Capital gains
Taxes owed chart
- Violet: Federal income tax
- Indigo: FICA (payroll tax)
- Orange: IRMAA (Medicare surcharge)
Tab 2 — Rates
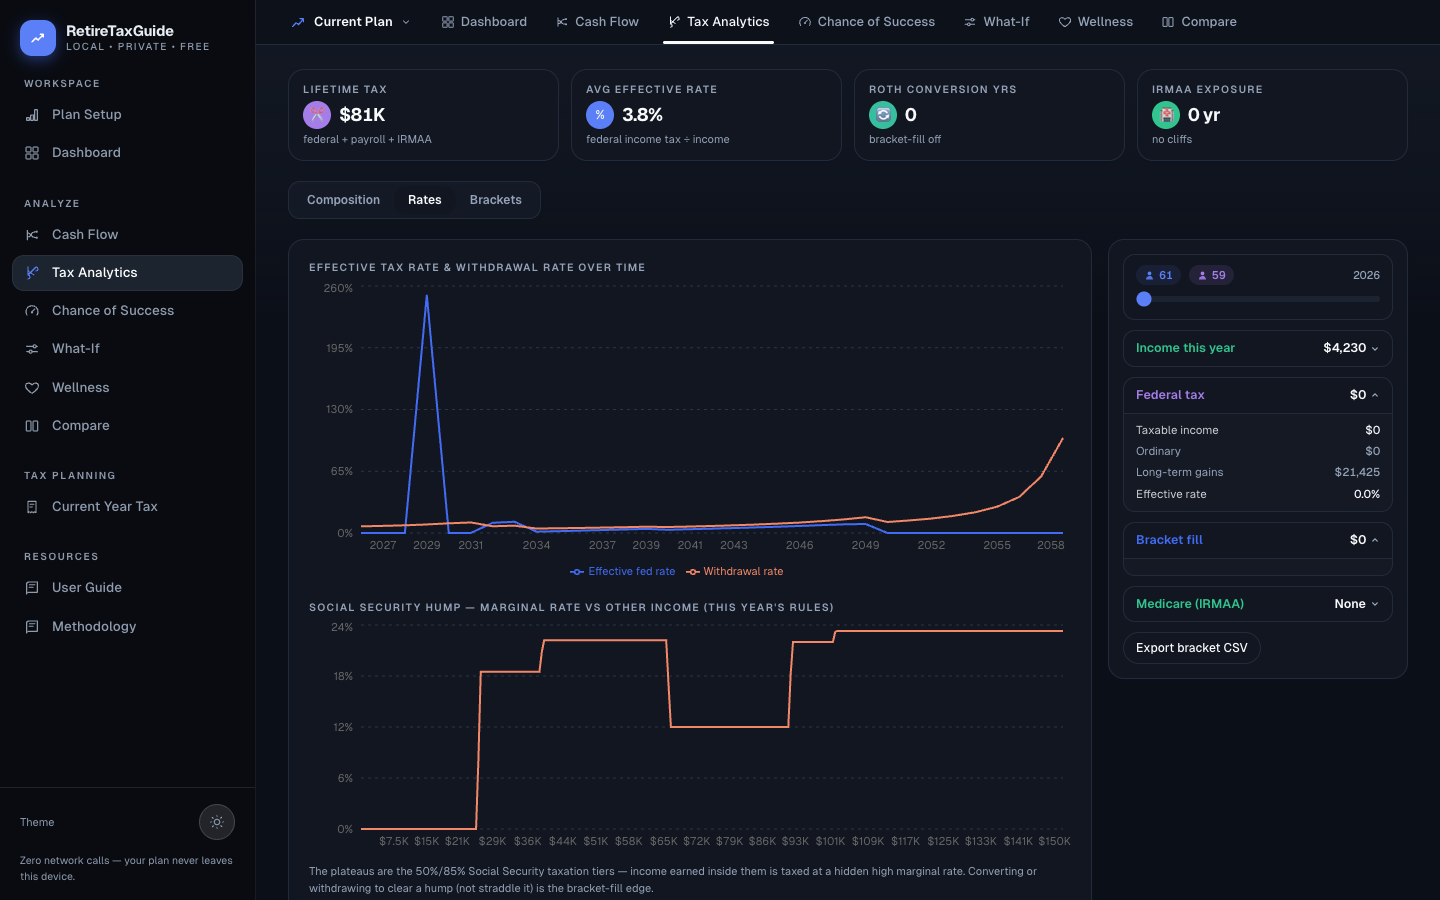
Effective and withdrawal rate
Two lines: effective federal rate (primary) and withdrawal rate (coral). The effective rate dips in early retirement and spikes when RMDs and SS both kick in.
Social Security hump
Single coral line plotting marginal rate vs other income. The plateaus are the 50%/85% SS taxation tiers.
How to read
Converting or withdrawing to clear a hump (not straddle it) is the bracket-fill edge.
Tab 3 — Brackets
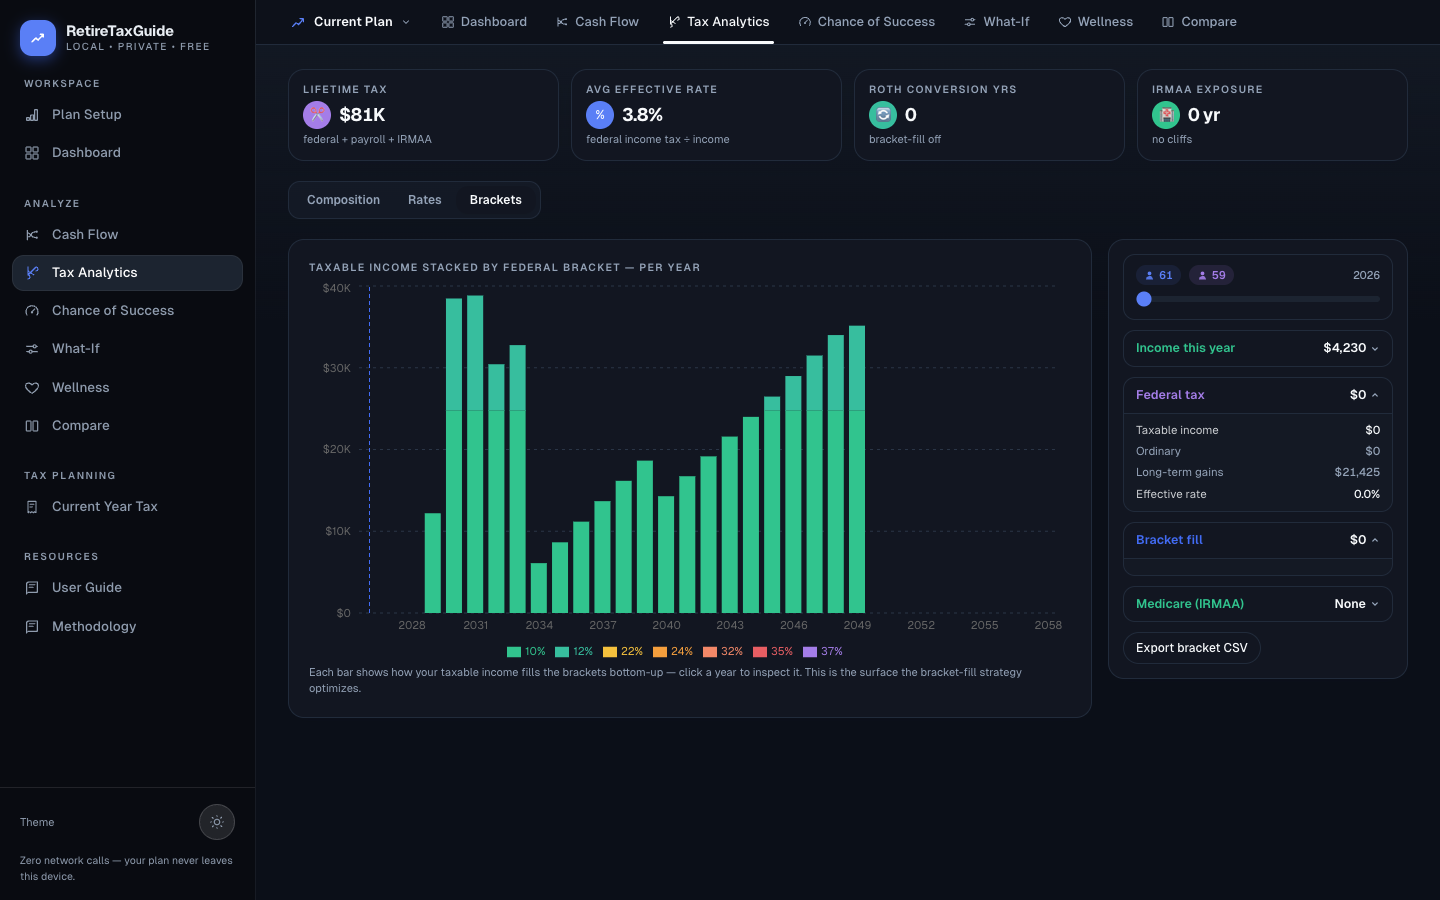
Stacked bar chart showing how taxable income fills the federal brackets bottom-up each year:
- Green: 10% bracket
- Teal: 12% bracket
- Yellow: 22% bracket
- Orange: 24% bracket
- Coral: 32% bracket
- Red: 35% bracket
- Violet: 37% bracket
Click any bar to jump to that year. A dashed reference line marks the scrubbed year.
Right rail (all tabs)
- YearScrubber: Person-age chips + slider + year
- Income this year (green): Wages, SS, pension, withdrawals, dividends, capital gains
- Federal tax (violet): Taxable income, ordinary, LTCG, effective rate, ACA subsidy
- Bracket fill (primary): One row per bracket
- Medicare/IRMAA (orange/green): Part B and Part D surcharges, cliff warnings
- Export bracket CSV: Downloads a CSV with year, each bracket, and total tax