Screenshots show the built-in sample plan — your numbers will look different, but the layout is the same.
Current Year Tax Planner
A sandbox for this year's tax decisions. Sliders, headroom ladder chart, guardrails, and tax-flow Sankey.
Five KPI cards (top row)
- Federal tax (violet): Current simulated tax with delta vs plan
- Taxable income (blue): Current simulated taxable income
- MAGI (indigo): Modified adjusted gross income
- IRMAA 2 yrs later (orange/green): Medicare surcharge or "None"
- ACA subsidy (teal): Subsidy amount or "N/A" with FPL percentage
Left panel — Move controls
The left rail sticks while you scroll, so the controls stay at hand. It holds two grouped cards plus a reset. Every change re-prices the whole year instantly — KPIs, headroom, and Sankey all move together.
Three lever sliders ("What you're doing this year")
One each for IRA/401(k) withdrawals, Roth conversions, and taxable brokerage long-term gain harvests. Each row has three parts: a label with a "reset" link (visible only once you move off plan), a slider paired with a synced dollar field, and a caption row reading "plan $X · max $Y".
- Drag the handle to adjust in $500 steps, or type an exact amount in the dollar field — both stay in sync both directions. The label turns blue once the value differs from plan.
- Ceilings: withdrawals and conversions top out at the plan's pre-tax capacity (e.g. "max $600,000"); the gain harvest tops out at plan gains plus available unrealized gain, spelled out as "$50,000 more available".
- Captions guide you: "plan has none — can only add" when the plan holds zero of that move, or "plan $18,252 — drag down to $0" when you can only reduce.
Seven income fields ("Income this year")
Salary/wages, short-term gains, taxable interest, qualified dividends, ordinary dividends, Social Security (gross), deferred compensation. Each field is seeded from the plan with the plan value as its caption — clearing a field means "use the plan." Overridden fields turn blue with their own reset link. These drive MAGI, so they move IRMAA and ACA headroom directly.
Reset button
"Reset to plan" at the panel's bottom right clears all moves and overrides at once. It stays disabled until you change something. Nothing here ever touches the saved plan — close the page and every tweak is gone.
View toggle
A segmented Headroom / Tax Flow switch above the right panel. Headroom answers "how much room is left"; Tax Flow shows where every dollar goes.
Right panel — Headroom view (default)
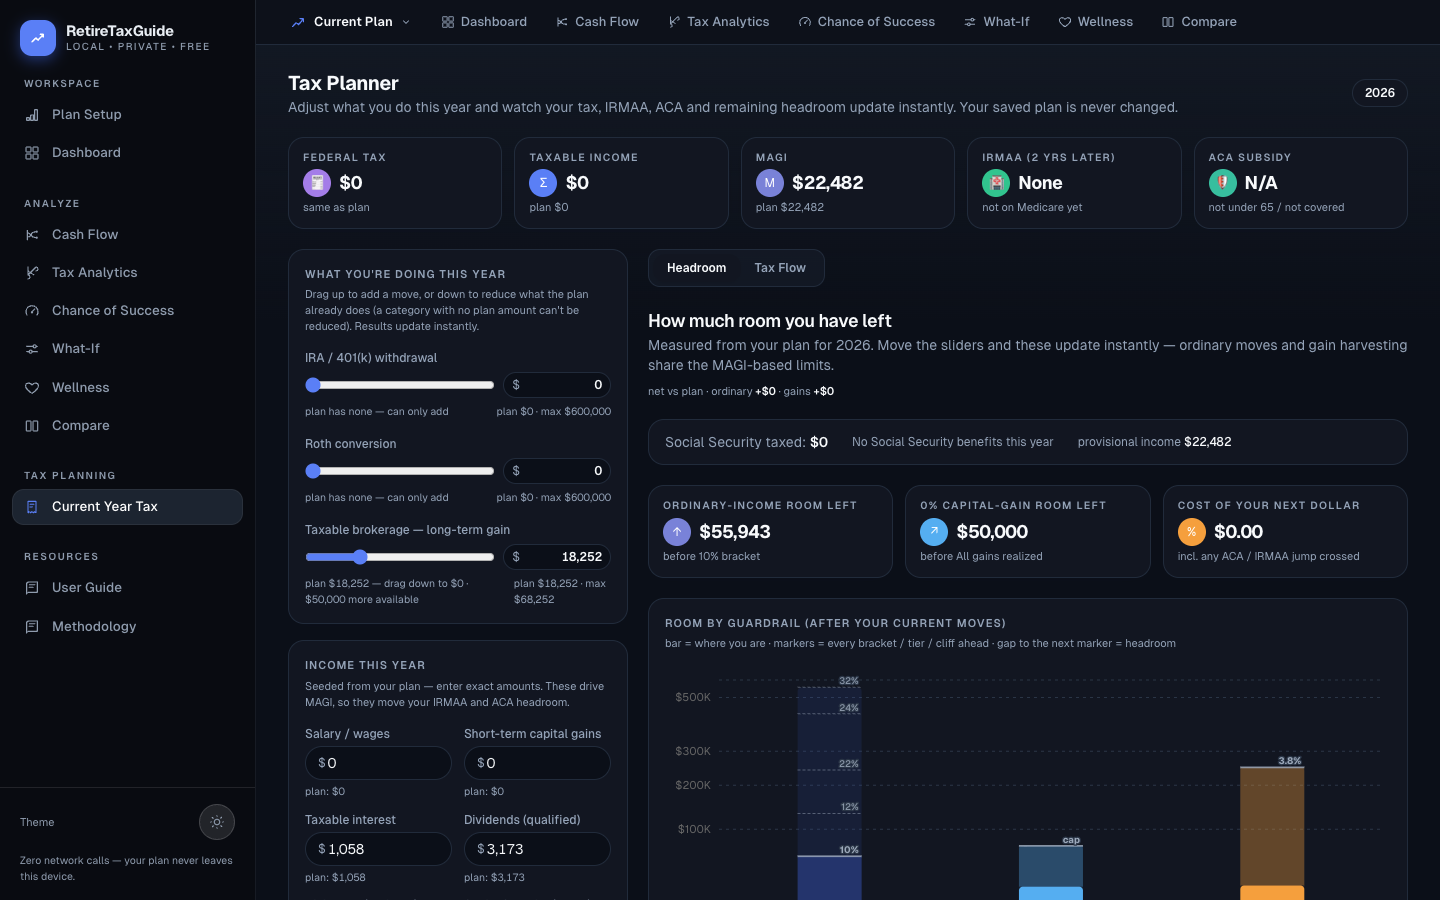
SS taxation summary bar
Shows taxable SS amount, inclusion tier label, and provisional income.
A "net vs plan" line tracks your total deviation from the plan, split into ordinary moves and gains — reductions show in green.
Three KPI cards
- Ordinary-income room left (indigo): Dollars before next threshold
- 0% capital-gain room left (sky): LTCG room before next threshold
- Cost of next dollar (orange): True marginal cost including ACA/IRMAA jumps
Headroom ladder chart
One bar per guardrail type. The Y-axis uses a square-root scale so near-term gaps stay visible next to far-off thresholds.
Right panel — Tax Flow view (Sankey)
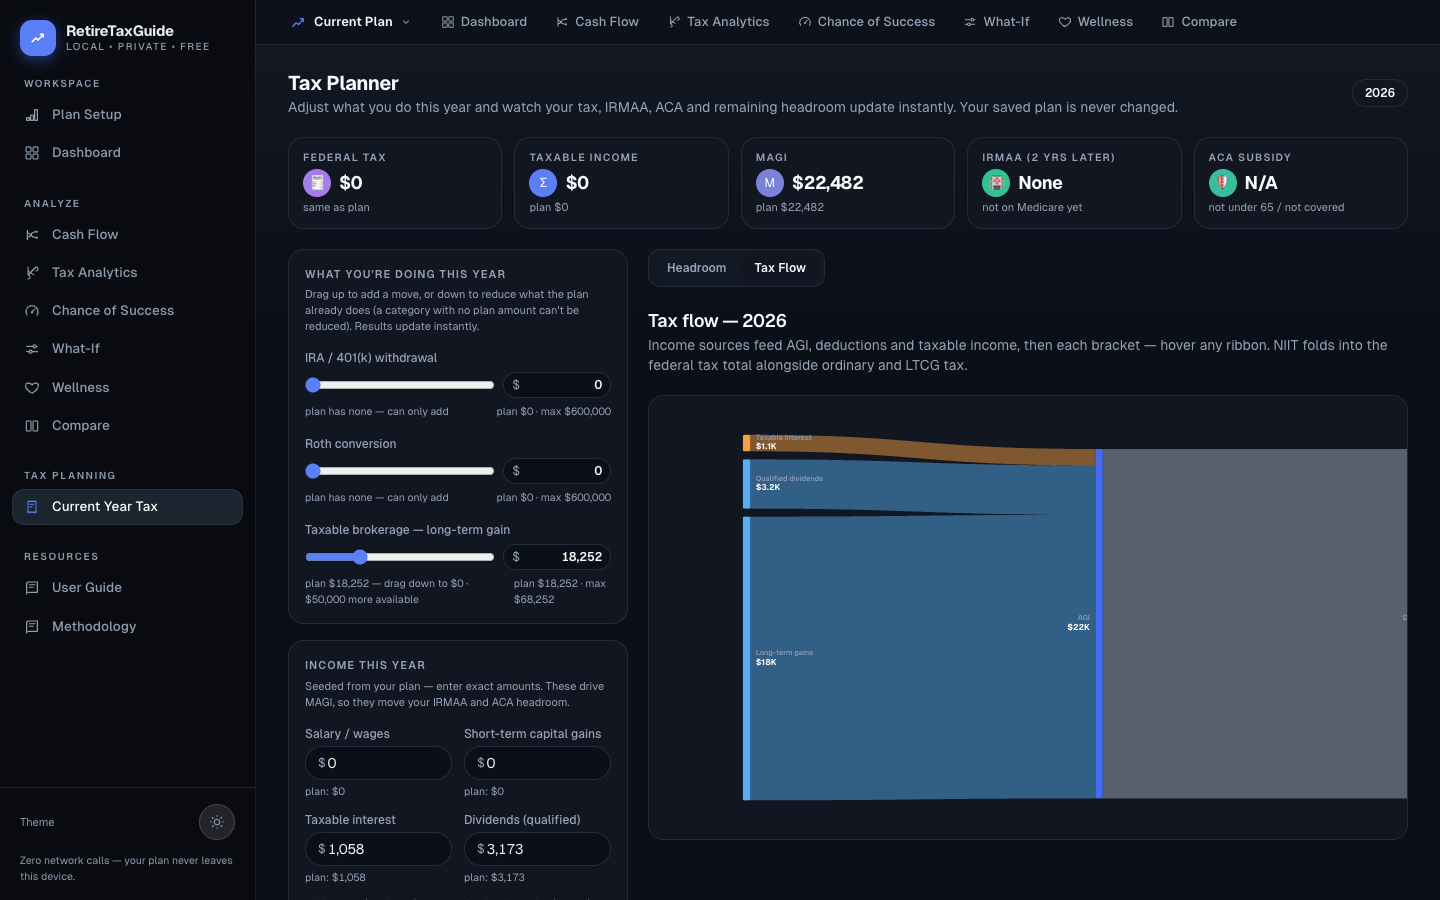
Read left to right: income sources feed into AGI, then deductions and taxable income, then each tax bracket, then the tax totals (ordinary, LTCG, NIIT), and finally the federal-tax total.
Node height is proportional to dollar amount. Ribbon width shows flow between nodes. Hover any ribbon for source, target, and dollar amount.