Guide HomeGetting StartedPlan Setup WizardDashboardCash FlowTax AnalyticsTax PlannerChance of SuccessWhat-If ScenariosWellness ScoreCompareYour Data & Privacy
Screenshots show the built-in sample plan — your numbers will look different, but the layout is the same.
Cash Flow
A visual money-flow diagram for any year. The Sankey diagram shows where every dollar comes from and where it goes.
Three KPI cards (top row)
- Money in (green): Total of all incomes + withdrawals. The sub-line names which simulated year you are viewing and the household age.
- Spending + tax (red): Total expenses + federal tax + FICA. Sub: percentage of inflow saved.
- Ending balance: Final account balance. Its sub-line reads "Depleted", "Surplus reinvested", or "Funded".
Year scrubber
Drag the slider — or use the arrow buttons and keyboard arrows — to travel through the simulation year by year. The person-age chips and year label update as you scrub, and the KPI cards plus the Sankey diagram below re-render for the selected year, so you can compare working years, early retirement, RMD years, and late retirement side by side.
Sankey money-flow diagram
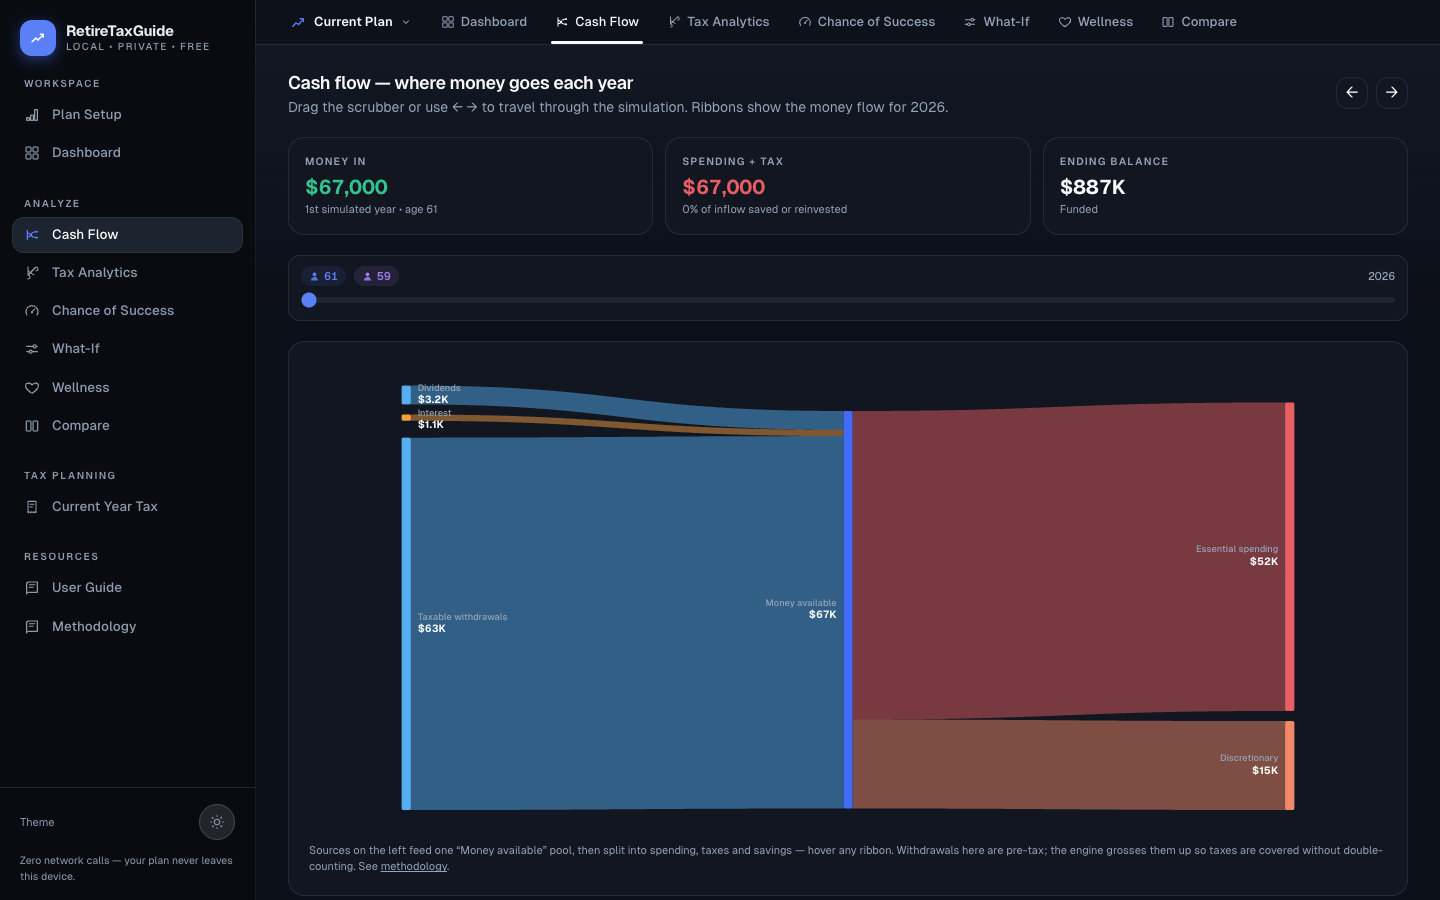
Withdrawals are shown pre-tax: the engine grosses them up so the tax bill is covered without double-counting.
How the columns work, left to right
- Income sources: Wages (green), Social Security (violet), Pension (teal), Dividends (sky), Interest (orange), Pre-tax withdrawals (indigo), Roth/tax-free (blue), Cash on hand. A red "Depleted balance" node appears when expenses exceed inflows.
- Money available (hub): The pooled inflow from all sources.
- Uses: Essential spending (red), Discretionary (coral), One-time (orange), Interval (yellow), Federal tax (violet), FICA (indigo), Savings (green/teal), and "Stays in accounts" (unspent surplus).
- Account buckets (right): Pre-tax 401(k)/IRA, Roth/HSA, Taxable & cash, Held as cash.
How to read
Trace where each dollar comes from (left column), pools in the hub, then fans out to spending, taxes, and savings. Hover any ribbon to see the source and target path with dollar amount.